Dairy Outlook: Supply Slows, Demand Improves
By: Robert Goodling, David Swartz, Claudia Schmidt, Timothy Beck and Virginia Ishler, Penn State University Extension
According to the most recent March numbers from USDA, the number of milk cows on farms in the United States in February 2019 was 77,000 head less than in February 2018. However, productivity per cow overall keeps increasing. For the 23 major dairy producing states, production per cow averaged 1,838 pounds for February 2019, an increase of 21 pounds from February 2018. Since USDA began reporting the 23 states series, this is the highest production per cow recorded for the month of February. Overall, U.S. milk production was up by 0.2 percent in February from a year earlier. However, in Pennsylvania, milk production has decreased by 6 percent in this time frame (NASS, 2019).
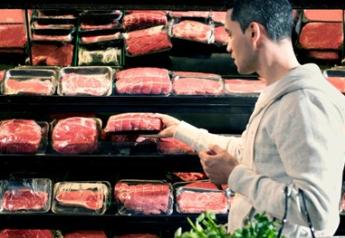
Things are improving on the consumption side, at least when it comes to butter and powder price trends. Butter usage in the US has increased by 2 percent from 2018. Butter inventories were down 9 percent by the end of February compared to February 2018. Global milk powder prices have increased and U.S. exports of milk powder increased by 18 percent in 2018 and inventories of NFDM at the end of January decreased by 10 percent from a year earlier (LMIC, 2019).
U.S. milk grew 15% in 10 years, just over 5% in Pennsylvania
U.S. milk production has increased from 190 to nearly 220 million pounds annually in the last 10 years, with only a 2% increase in milk cows during the same time period (NASS, 2019). The top five milk producing states as of 2018 were California, Wisconsin, Idaho, New York, and Texas. Pennsylvania is currently 7th in total milk production. Figure 1 depicts the percent change over the last 10 years for these states in relation to milk production, milk cows, milk per cow, and licensed dairy operations. Pennsylvania has seen minimal change in milk production over the last 10 years as compared to other top dairy states. It has also had the largest percentage decrease in cow numbers, while states like Texas and Idaho have seen modest increases. Milk production per cow is an interesting aspect for Pennsylvania. It has seen only about half the increase in per cow production as most other top dairy states. What the figure doesn't show is Pennsylvania per cow production is one of the lowest for the top ten milk producing states. Recently, there has been a lot of press over the number of farms leaving the industry and Pennsylvania has seen it's share of farm contraction. Pennsylvania is only behind Wisconsin in the the total number of farms in 2018, so seeing a percent decrease over the last 10 years of just 16% shows the state's industry is not contracting as rapidly other dairy states.
Figure 1: Percent Change in Dairy Metrics from 2009 to 2018 for Pennsylvania and the Top Five Dairy States

(NASS, 2010; NASS 2019).
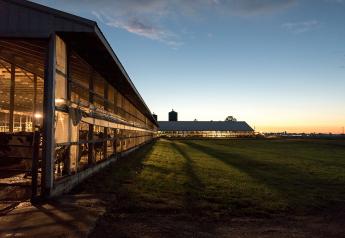
In the past, Wisconsin’s and Pennsylvania’s dairy industry had looked similar; with many smaller dairy operations housed in stanchion barns. However, the graphs illustrate the astounding transformation in the Wisconsin dairy industry over the past decade. Dairy farms have decreased by nearly 40% as cow numbers have increased slightly and milk production is up over 20%. While the current and expected changes in Pennsylvania’s dairy industry may not be as extensive as the changes experienced over the past decade in Wisconsin, we do expect some similar trends to occur in Pennsylvania.
Income Over Feed Cost, Margin, and All Milk Price Trends
February final prices had slight positives on most fronts. All milk price was up slightly over the previous month and feed cost was slightly lower (due to a more reasonable PA hay market average in Feb.). Class III and Class IV futures are continuing a gradual increase thru the remainder of the year currently, suggesting PA all milk price could approach $20/cwt by the end of the year.
Table 1: Twelve month Pennsylvania and U.S. All Milk Income, Feed Cost, Income Over Feed Cost ($/milk cow/day)

¹Based on corn, alfalfa hay, and soybean meal equivalents to produce 75 lbs. of milk (Bailey & Ishler, 2007)
²The 3 year average actual Milk Margin breakeven in Pennsylvania from 2015-2017 was $12.33 ± $2.29 ($/cwt) (Beck, Ishler, Goodling, 2018).
Table 2: Twelve month Pennsylvania and U.S. All Milk Price, Feed Cost, Milk Margin ($/cwt for lactating cows)

¹Based on corn, alfalfa hay, and soybean meal equivalents to produce 75 lbs. of milk (Bailey & Ishler, 2007)
²The 3 year average actual Milk Margin breakeven in Pennsylvania from 2015-2017 was $12.33 ± $2.29 ($/cwt) (Beck, Ishler, Goodling, 2018).
Figure 2: Twelve month Pennsylvania Milk Income and Income Over Feed Cost ($/milk cow/day)

²The 3 year average actual IOFC breakeven in Pennsylvania from 2015-2017 was $9.00 ± $1.67 ($/milk cow/day) (Beck, Ishler, Goodling, 2018).
Figure 3: Twenty-four month Actual and Predicted* Class III, Class IV, and Pennsylvania All Milk Price ($/cwt)

*Predicted values based on Class III and Class IV futures regression (Gould, 2019).
Table 3: Twenty-four month Actual and Predicted* Class III, Class IV, and Pennsylvania All Milk Price ($/cwt)
| Month | Class III Price | Class IV Price | PA All Milk Price |
|---|---|---|---|
| Mar-18 | $14.22 | $13.04 | 16.0 |
| Apr-18 | $14.47 | $13.48 | 16.4 |
| May-18 | $15.18 | $14.57 | 16.7 |
| Jun-18 | $15.21 | $14.91 | 17.0 |
| Jul-18 | $14.10 | $14.14 | 16.2 |
| Aug-18 | $14.95 | $14.63 | 16.4 |
| Sep-18 | $16.09 | $14.81 | 17.1 |
| Oct-18 | $15.53 | $15.01 | 18.1 |
| Nov-18 | $14.44 | $15.06 | 18.0 |
| Dec-18 | $13.78 | $15.09 | 17.6 |
| Jan-19 | $13.96 | $15.48 | 17.7 |
| Feb-19 | $13.89 | $15.86 | 17.9 |
| Mar-19 | $15.04 | $15.71 | $18.30 |
| Apr-19 | $15.89 | $15.86 | $18.63 |
| May-19 | $15.65 | $16.20 | $18.67 |
| Jun-19 | $15.74 | $16.48 | $18.85 |
| Jul-19 | $16.05 | $16.70 | $19.22 |
| Aug-19 | $16.31 | $16.85 | $19.42 |
| Sep-19 | $16.50 | $16.92 | $19.55 |
| Oct-19 | $16.50 | $16.95 | $20.30 |
| Nov-19 | $16.41 | $16.89 | $20.22 |
| Dec-19 | $16.28 | $16.80 | $20.11 |
| Jan-20 | $15.99 | $16.63 | $19.82 |
| Feb-20 | $15.96 | $16.60 | $19.79 |
*Italicized predicted values based on Class III and Class IV futures regression (Beck, Ishler, and Goodling 2018; Gould, 2019).
To look at feed costs and estimated income over feed costs at varying production levels by zip code, check out the Penn State Extension Dairy Team's DairyCents or DairyCents Pro apps today.
Data sources for price data
- All Milk Price: Pennsylvania and U.S. All Milk Price (USDA National Ag Statistics Service, 2019)
- Current Class III and Class IV Price (USDA Ag Marketing Services, 2019)
- Predicted Class III, Class IV Price (Gould, 2019)
- Alfalfa Hay: Pennsylvania and U.S. monthly Alfalfa Hay Price (USDA National Ag Statistics Service, 2019)
- Corn Grain: Pennsylvania and U.S. monthly Corn Grain Price (USDA National Ag Statistics Service, 2019)
- Soybean Meal: Feed Price List (Ishler, 2019) and average of Decatur, Illinois Rail and Truck Soybean Meal, High Protein prices, National Feedstuffs (USDA Ag Marketing Services, 2019)
References
- Bailey, K. and V. Ishler. “ Dairy Risk-Management Education: Tracking Milk Prices and Feed Costs ”. Penn State Extension. Accessed 9/20/2017.
- Beck, T.J., Ishler, V.A., & Goodling, R. C. 2018. “Dairy Enterprise Crops to Cow to Cash Project,” the Pennsylvania State University. Unpublished raw data.
- Dairy Records Management Systems. “DairyMetrics Online Data Report system”. Accessed 9/14/2017.
- Gould, B. 2019. “Mailbox Price Forecaster". Dairy Marketing Tools website. University of Wisconsin-Madison. Accessed 4/1/2019.
- Ishler, V. “ DairyCents Mobile App ”. Penn State Extension. #App-1010.
- Ishler, V. “ DairyCents Pro Mobile App ”. Penn State Extension. #App-1009.
- Ishler, V. “Feed Price List”. Personal Communication. Accessed 4/1/2019.
- LMIC (Livestock Marketing Information Center). "Livestock Monitor". lmic.info/ March 25, 2019
- Microsoft 2016. “Forecast.ets function”, Office Help Website.
- USDA National Ag Statistics Service, 2019. Agricultural Prices, Quick Stats version 2.0. Accessed 4/1/2019.
- USDA Ag Marketing Services, 2019. Milk Marketing Order Statistics. Accessed 4/1/2019.
- USDA Ag Marketing Services, 2019. “National Feedstuffs: Soybean Meal, High Protein”. Summary of USDA AMS Grain Reports. Accessed 4/1/2019.
- USDA National Ag Statistics Service, 2010. "Milk Production". Released February 19, 2010. Accessed 3/25/2019.
- USDA National Ag Statistics Service, 2019. "Milk Production". Released March 19, 2019. Accessed 3/25/2019.