DMC Payments Surpass $611 Million for the First Half of 2023
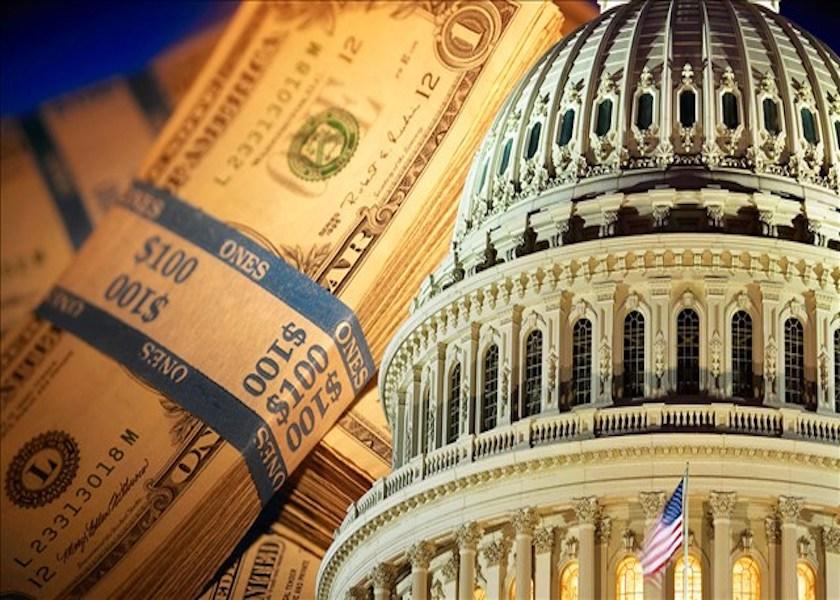
Dairy Margin Coverage (DMC) payments have been a small bright spot in dairy producers’ pocketbooks throughout 2023 as milk prices tumble and feed costs skyrocket. For the first half of the year, nearly $612 million in government payments have been issued, a vastly different picture compared to last year.
With milk prices more favorable in 2022, only $83.7 payments were issued with the average operation receiving $4,662 in total. In comparison, each operation enrolled in DMC has received an average of $36,137 during the first half of the year – and there are still six more potential payment months to go.
The Dairy State has received the most money thus far with more than $136 million in payments issued across the state’s 4,256 operations enrolled. Here’s how other major dairy-producing states faired:
|
State |
Total Payment |
Average Payment Per Operation |
Enrolled Operations |
Percent Enrolled
|
|
Wisconsin |
$136,170,490 |
$31,994.95 |
4,256 |
77.7% |
|
California |
$60,641,654 |
$64,996.41 |
933 |
76% |
|
New York |
$58,009,287 |
$32,173.76 |
1,803 |
71.8% |
|
Minnesota |
$52,204,524 |
$30,762.83 |
1,697 |
84.3% |
|
Pennsylvania |
$50,434,268 |
$28,786.68 |
1,752 |
69.6% |
|
Michigan |
$27,655,307 |
$43,551.66 |
635 |
65% |
|
Iowa |
$23,037,934 |
$37,521.07 |
614 |
77.2% |
|
Texas |
$14,730,199 |
$57,765.49 |
255 |
75.2% |
|
Vermont |
$14,369,957 |
$33,732.29 |
426 |
73.8% |
|
Idaho |
$12,585,494 |
$52,880.23 |
238 |
72.3% |
Statistics comparing 2023 to 2022 include:
|
Year |
Operations Enrolled |
Percent Enrolled |
Payments |
Average Amount Paid Per Operation |
|
First Six Months of 2023 |
16,929 |
73% |
$611,939,041 |
$36,147* |
|
2022 Total |
17,965 |
71.5% |
$83,752,968 |
$4,662* |
*This figure is an average that is dependent on production history as well as the selected coverage percentage and coverage level under the program.